A pair of indieVelo Beta-testers put the velocity of two virtual cycling esports platforms—indieVelo and Zwift—to the test in a demonstrational quasi-scientific experiment.
The Hypothesis:
The velocity-deriving factors speed and wkg differ across Zwift and indieVelo virtual platforms and impact the user experience.
The Purpose:
Take a practical hands-on approach to highlight the significance of utilizing raw power and speed when determining in-game velocity compared to the strict use of wkg for realism and authenticity.
The Test Subjects:
Beta-testers Nicholai Nielsen (81kg) and Dean Cunningham (64kg)
The Experiment:
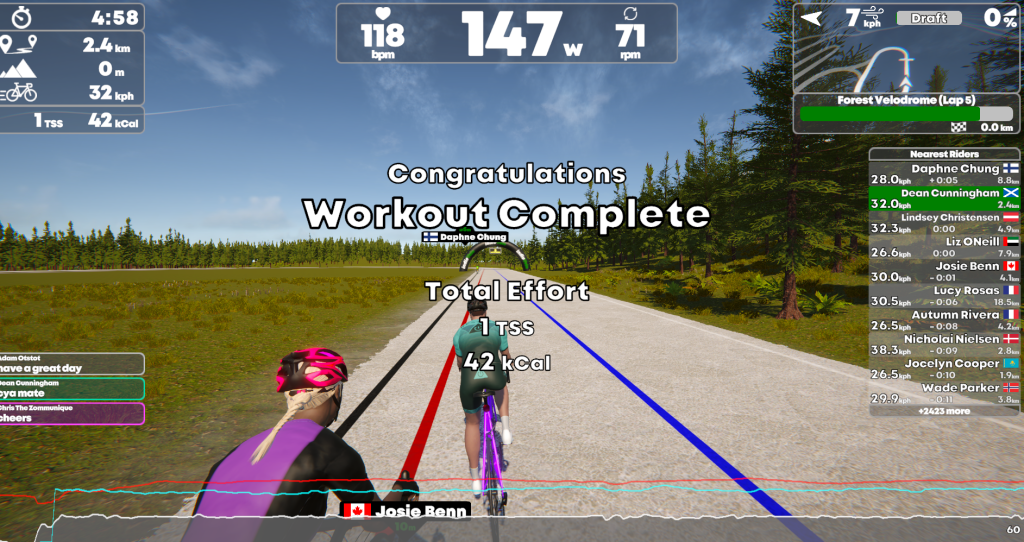
The subjects each performed two trials, one on the virtual cycling platform Zwift and the other on indieVelo. Rider One, Nicholai, was instructed to maintain 250W (3.07wkg), which is low Z2, and Rider Two held 150W (2.34wkg), very low Z1 for him.
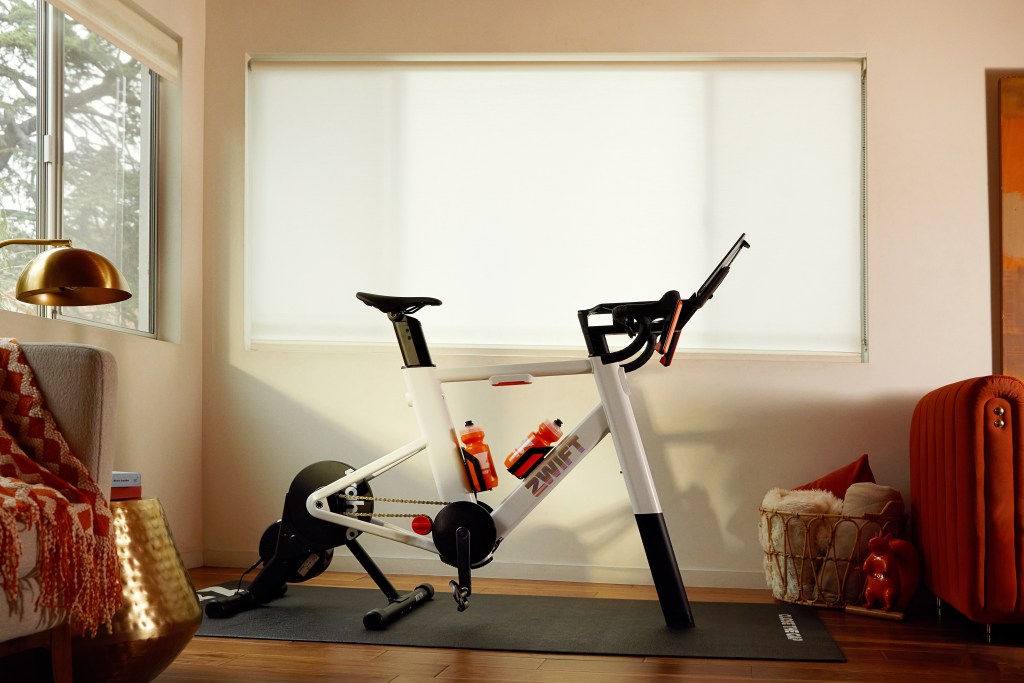
The subjects rode Tron bikes when performing the Zwift trial and similar aero frames on indieVelo. The testers selected a flat course for each trial, Tempus Fugit for Zwift, and the Forest Velodrome when on indieVelo, and they took steps to decrease the draft effect of nearby riders.
The Results
On Zwift, Rider One (Nicholai) covered 3.2 km (1.99 mi) at an average velocity of 38.4 kph (23.9 mph) while maintaining 250W for 5 minutes. Rider Two (Dean) produced an average speed of 33.6 kph (20.9 mph) over 2.8 km (1.74 mi) at 150W for the trial period.
On indieVelo, Rider One rode 3 km (1.86 mi) at an average speed of 36 kph (22.4 mph), and Rider Two did 28.8 kph (17.9 mph) for 2.4 km (1.49).
Anecdotal Analysis and Observations of Beta-tester Nicholai Nielsen
When we (Nicholai and Dean) began the 5-minute trial on Zwift, we suspected that we were riding too fast for Z1/Z2 efforts.
On indieVelo, we had the sense that the speed derivation quite comfortably considers raw power, as opposed to using wkg as the sole factor.
Our average speed on indieVelo was much closer to what we would find out on the road under similar conditions. My number was realistic for a pancake flat real-life route. Perhaps more interestingly, Dean didn’t even break 30 kph, which is consistent with the recovery pace he rode.
So, Nicholai decided to test his hypothesis.
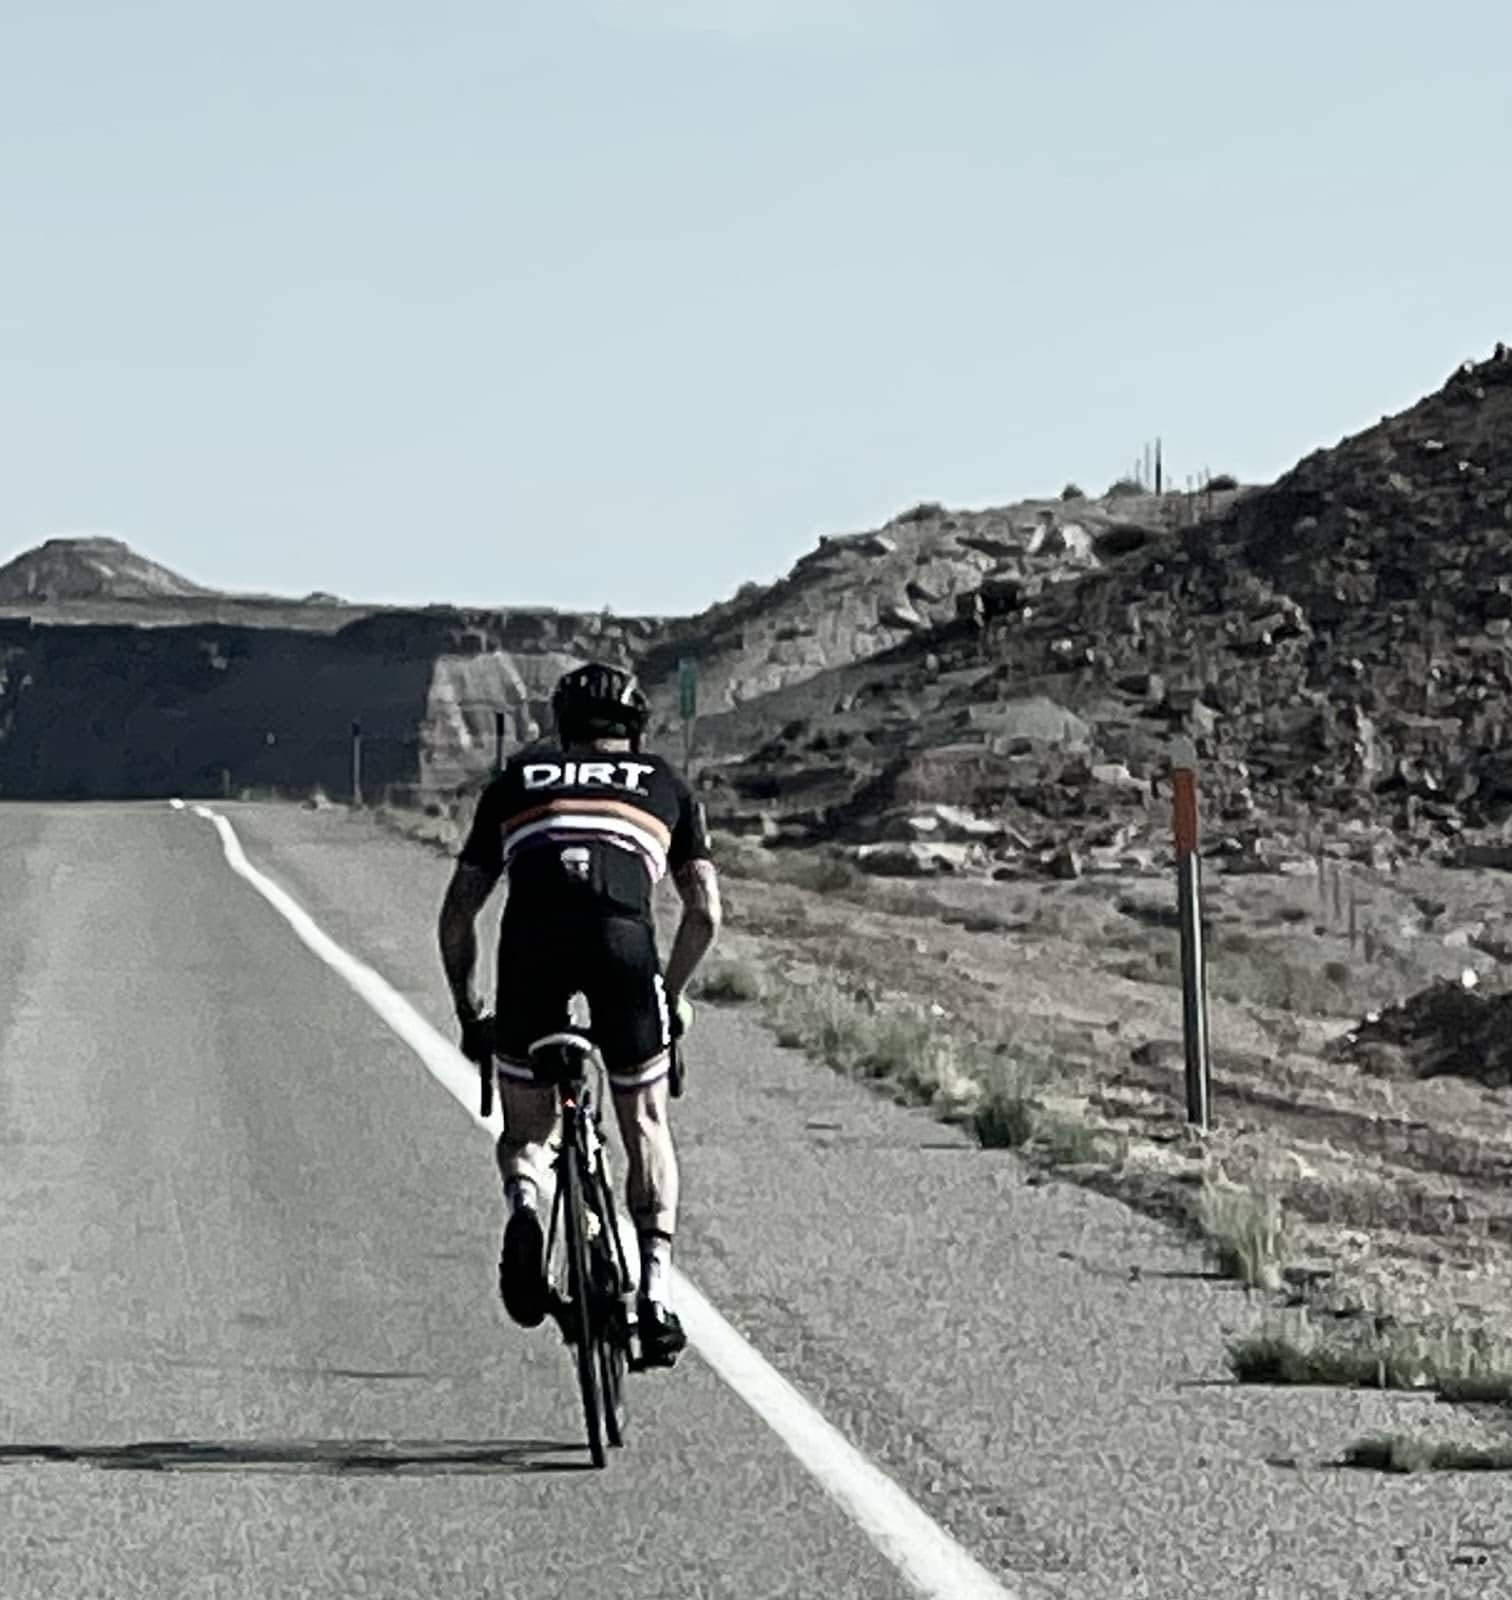
Taking the Show On The Road
The Setup: Canyon Aeroad with eTap AXS and a set of ENVE 5.6 Disc Wheels, wrapped in a set of Continental GP5000 tires. A pretty sweet aero rig!
A Garmin 830 paired with a set of Favero Assioma Duo watt pedals—a fine power meter accuracy and reliability standard.
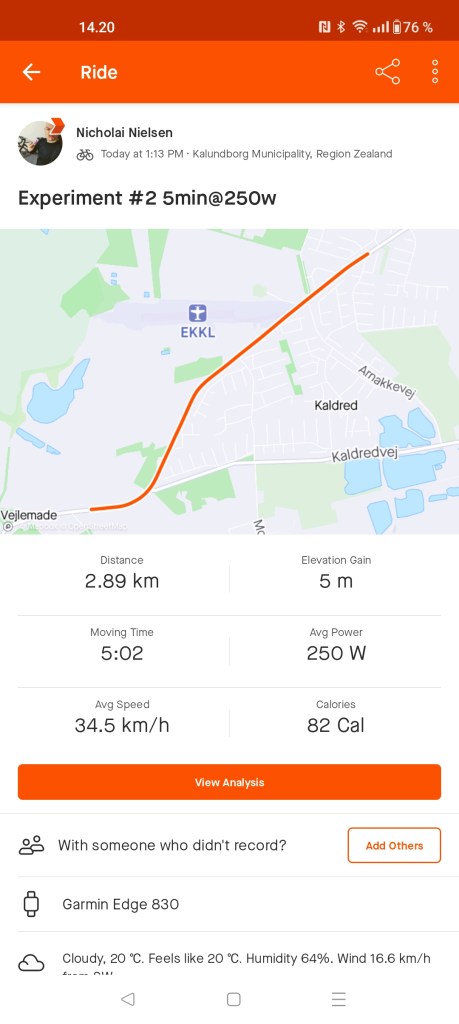
The Experiment: To reproduce the 250W for :5 trial, but this time on the open road. Rider One (Nicholai) replicated the indieVelo trial wind (5-7 kph) and course profile (5 m of elevation gain) as closely as possible. Two trials were performed on the same stretch of road in opposite directions to account for wind and elevation changes.
The Results: The data from the two trials were averaged to reveal, Test subject Nicholai traveled 3.04 km (1.9 mi) at an average velocity of 36.4 kph (22.6 mph).
The Assessment: There was a difference of 2.0 kph (1.24 mph) from the average speed on Zwift, and the difference on indieVelo was .4 kph (.25 mph). Rider One traveled 3.04 km on the open road, 3.2 km on Zwift, and 3 km on indieVelo.
Climbing trials are next!
Pointing The Wheel Upward
The Experiment: Rider One (Nicholai) reproduced the 250W for :5 trials on multiple climbs of varying steepness on the virtual cycling platforms Zwift and indieVelo.
The Results:
Zwift
Trial #1: 19.2 kph (11.9 mph) on a 4.18% avg. gradient (67 m)
Trial #2: 12 kph (7.5 mph) on a 8.1% avg. gradient (81 m)
Trial #3: 9.6 kph (6 mph) on a 10.6% avg. gradient (85 m)
indieVelo
Trial #1: 14.4 kph (8.9 mph) on a 5.5% avg. gradient (66 m)
Trial #2: 10.8 kph (6.7 mph) on an 8% avg. gradient (72 m)
The Assessment: On a climb of ~4-5%, there was a 5.8 kph (3.6 mph) difference between Zwift and indieVelo. On a climb of ~8%, there was a 1.2 kph (.75 mph) deviation. Rider One traveled at an average velocity of 12 kph (7.5 mph) on an 8.1% climb on Zwift and 14.4 kph (8.9 mph) on a 5.5% climb on indieVelo.
There was an average velocity difference of 2.4 kph (1.5 mph) between an 8.1% Zwift climb and a 5.5% climb on indieVelo. That’s an 18.2% increase in velocity, but a 38.2% gradient difference.
Conclusion:
Flat Course Results
| Rider | Platform | Distance (km) | Average Speed (kph) | Power (W) |
|---|---|---|---|---|
| Nicholai | Zwift | 3.2 | 38.4 | 250 |
| Nicholai | indieVelo | 3.0 | 36.0 | 250 |
| Dean | Zwift | 2.8 | 33.6 | 150 |
| Dean | indieVelo | 2.4 | 28.8 | 150 |
Real-Life Road Trial Results
| Rider | Distance (km) | Average Speed (kph) | Power (W) |
|---|---|---|---|
| Nicholai | 3.04 | 36.4 | 250 |
Climbing Results
| Rider | Platform | Gradient (%) | Average Speed (kph) | Power (W) |
|---|---|---|---|---|
| Nicholai | Zwift | 4.18 | 19.2 | 250 |
| Nicholai | indieVelo | 5.5 | 14.4 | 250 |
| Nicholai | Zwift | 8.1 | 12.0 | 250 |
| Nicholai | indieVelo | 8.0 | 10.8 | 250 |
| Nicholai | Zwift | 10.6 | 9.6 | 250 |
Flat Course Comparison
| Rider | Platform | Real-Life Speed (kph) | Virtual Speed (kph) | Difference (kph) |
|---|---|---|---|---|
| Nicholai | Zwift | 36.4 | 38.4 | 2.0 |
| Nicholai | indieVelo | 36.4 | 36.0 | -0.4 |
Climbing Comparison
| Rider | Platform | Gradient (%) | Virtual Speed (kph) | Difference (kph) | Gradient Difference (%) | Velocity Increase (%) |
|---|---|---|---|---|---|---|
| Nicholai | Zwift vs indieVelo | 4-5 | 19.2 vs 14.4 | 5.8 | N/A | N/A |
| Nicholai | Zwift vs indieVelo | 8 | 12.0 vs 10.8 | 1.2 | N/A | N/A |
| Nicholai | Zwift vs indieVelo | 8.1 vs 5.5 | 12.0 vs 14.4 | 2.4 | 38.2 | 18.2 |
Nicholai and his fellow Beta-test subjects aren’t here to say choose one way or another. They prefer to let the numbers tell the story.
Thanks Beta-testers Nicholai Nielsen and Dean Cunningham!
Semi-retired after more than 20 years as the owner and director of a private Orthopedic Physical Therapy practice, Chris now enjoys the freedom to dedicate himself to his passions—virtual cycling and writing.
Driven to give back to the sport that has enriched his life with countless experiences and relationships, he founded a non-profit organization, TheDIRTDadFund. In the summer of 2022, he rode 3,900 miles from San Francisco to his “Gain Cave” on Long Island, New York, raising support for his charity.
His passion for cycling shines through in his writing, which has been featured in prominent publications like Cycling Weekly, Cycling News, road.cc, Zwift Insider, Endurance.biz, and Bicycling. In 2024, he was on-site in Abu Dhabi, covering the first live, in-person UCI Cycling Esports World Championship.
His contributions to cycling esports have not gone unnoticed, with his work cited in multiple research papers exploring this evolving discipline. He sits alongside esteemed esports scientists as a member of the Virtual Sports Research Network and contributes to groundbreaking research exploring the new frontier of virtual physical sport. Chris co-hosts The Virtual Velo Podcast, too.